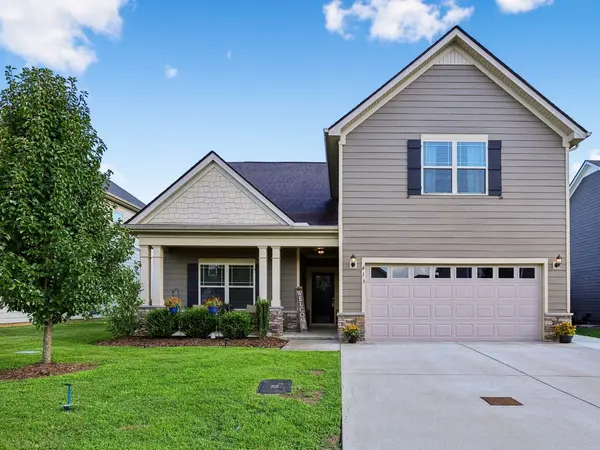
Are Home Prices Rising or Falling in Oak Hill, TN?
Of all the cities near Nashville, TN, Oak Hill has posted one of the sharpest price increases over the past year. Here's a look at what's behind the numbers and what it means for you.
The National Picture
As of the 3 months ending August 2026, the U.S. median home price is $398,596, up 2% year over year. The affordability picture has brightened slightly: the typical household earns about $87,599 and now puts roughly 34% of income toward housing, down nearly 2 percentage points. Around 20% of listings have had a price cut, homes take 50 days to sell, and there are about 4 months of supply.
Home Prices in the Nashville Area
Metro-wide, Nashville's median sale price is about $480,000, essentially flat. A typical household earns around $96,448 and puts 36.3% of income toward housing. Oak Hill, with a median approaching $1.9 million, is among the metro's most expensive addresses and operates in a niche where broader market trends often do not apply.
A 45% Surge in a Low-Volume Market
Oak Hill's median sale price soared 45% year over year to $1,848,777. That eye-catching number comes with an important caveat: only 29 homes sold during the period, so a handful of high-end transactions can shift the median dramatically. About 41% of listings carry a price cut, and homes sit on the market a median of 78 days. Just 3.6% of sales closed above asking, with the typical home fetching 94% of its list price. Neighboring Forest Hills saw prices fall 9%, a stark contrast.
Why Are Prices Rising in Oak Hill?
The surge is largely a function of the mix of homes that sold. Active listings rose 28% and new listings grew about 14%, but pending sales dropped 22%. With 4.6 months of supply and a sale-to-list ratio of 94%, buyers are not exactly paying premiums. The price jump likely reflects a shift toward higher-priced properties trading hands rather than across-the-board appreciation. In luxury markets with fewer than 30 annual sales, the median can swing sharply based on which homes happen to close.
| City | Median Price | Price YoY | Price Drops | Months of Supply |
|---|---|---|---|---|
| Oak Hill ★ | $1,848,777 | +45.0% | 41.1% | 4.6 |
| Forest Hills | $2,254,508 | -8.7% | 39.6% | 4.1 |
| Belle Meade | $4,297,155 | +37.3% | 21.4% | 5.4 |
| Brentwood | $1,424,058 | +5.1% | 35.9% | 4.2 |
| Franklin | $862,929 | +12.4% | 30.3% | 3.6 |
| Nolensville | $929,385 | -7.1% | 29.2% | 3.9 |
Limited to cities with at least 10 home sales in the period.
All data comes from Redfin and represents a 3 months ending August 2026. This article has been generated, in whole or in part, using generative artificial intelligence (AI) technology, with input from Redfin head of economics research Chen Zhao. While efforts have been made to ensure the accuracy and reliability of this information, you should independently verify all data, facts, and citations contained in this article before relying on it for any purpose. This information is not a substitute for advice from a real estate agent, financial advisor, or other licensed professional. Check the Redfin Data Center for additional in-depth housing market data.
Categories
Recent Posts